
Laravel Telescope: See What Happens Inside Your Application
A practical guide to installing and using Laravel Telescope to inspect requests, queries, jobs, exceptions, cache operations, and events safely.
Laravel Telescope: See What Happens Inside Your Application
Your API works and returns the expected response, but what actually happened behind the scenes?
How many queries ran? Why did the request take so long? Did the job reach the queue or fail? Did the data come from cache or the database?
You can search through log files and place dd() calls around the code, but each one shows only a small part of the story. This is where Laravel Telescope helps.
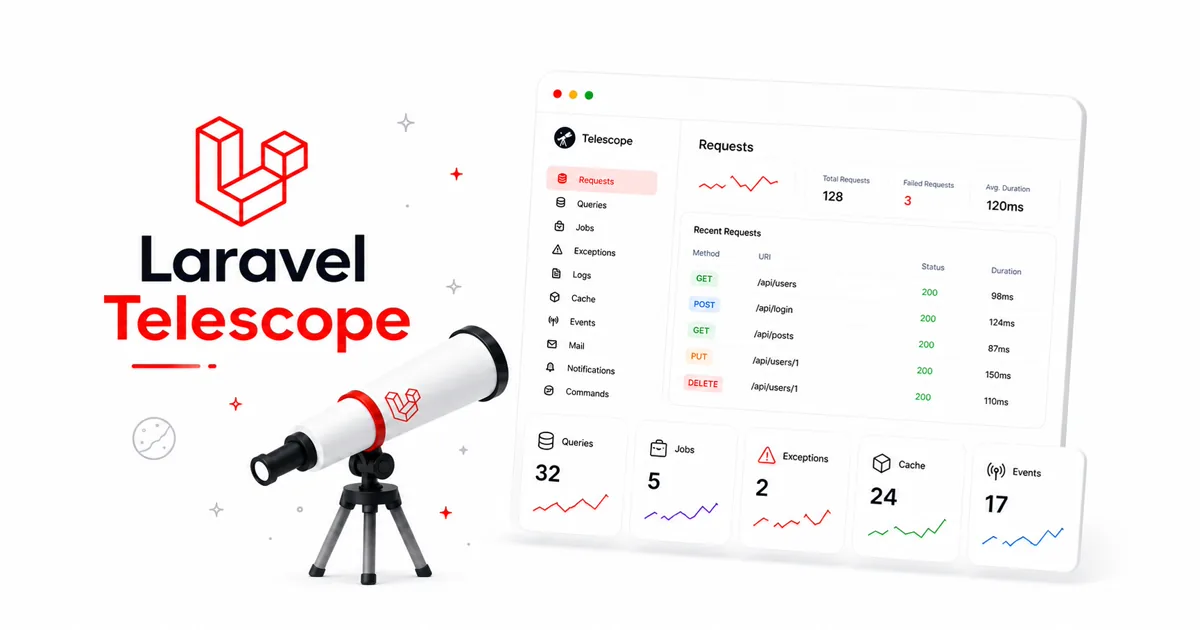
Telescope is an official Laravel package that records application activity and presents it in one dashboard: requests, queries, jobs, exceptions, logs, cache operations, events, mail, and more. It does more than show that something failed. It helps you connect related entries and understand the complete execution path.
When is Laravel Telescope useful?
Telescope is especially useful during development and focused debugging sessions, including when:
- an endpoint works but responds slowly;
- a page executes too many queries or has an N+1 problem;
- a queued job does not run as expected or fails;
- an intermittent exception needs its stack trace and related request data;
- a cache key is not read or refreshed when expected;
- an event was dispatched, but you are unsure which listeners handled it;
- an outgoing HTTP request is slow or returns an error.
It is a deep debugging tool for individual operations, not a complete replacement for long-term monitoring and alerting. Use it carefully in production because its data can grow quickly and may include sensitive details.
Install Laravel Telescope
For a standard installation, run:
composer require laravel/telescope

php artisan telescope:install
php artisan migrate
The telescope:install command publishes the configuration and migrations and creates a TelescopeServiceProvider. After running the migrations, open:
http://your-app.test/telescope
You should see the Telescope dashboard, and new application requests will begin appearing there.
Install Telescope for local development only
If you only need Telescope during local development, install it as a development dependency:
composer require laravel/telescope --dev

php artisan telescope:install
php artisan migrate
The --dev flag is not enough by itself. Remove the App\Providers\TelescopeServiceProvider registration from bootstrap/providers.php, then register both providers only in the local environment from AppServiceProvider:
public function register(): void
{
    if (
        $this->app->environment('local') &&
        class_exists(\Laravel\Telescope\TelescopeServiceProvider::class)
    ) {
        $this->app->register(\Laravel\Telescope\TelescopeServiceProvider::class);
        $this->app->register(TelescopeServiceProvider::class);
    }
}
Also prevent package auto-discovery in composer.json:
{
  "extra": {
    "laravel": {
      "dont-discover": [
        "laravel/telescope"
      ]
    }
  }
}
This prevents production from trying to load a class provided only through require-dev.
A quick dashboard tour
The /telescope dashboard contains several sections. You do not need to learn all of them immediately. Start with the one related to the problem you are investigating.
Requests: inspect the complete operation
The Request Watcher shows information such as:
- HTTP method, path, and status code;
- request duration and memory usage;
- headers, payload, session, and response;
- the authenticated user, when available;
- related queries, events, jobs, and other entries recorded during the request.
When an endpoint is slow, open the request and inspect its related queries and HTTP calls. The bottleneck is often not the controller itself, but a repeated query or an external service that took too long.
Queries: find slow SQL and N+1 problems
The Query Watcher records SQL, bindings, and execution time. By default, it tags queries that take longer than 100 milliseconds as slow. You can change that threshold in config/telescope.php:
use Laravel\Telescope\Watchers;

'watchers' => [
    Watchers\QueryWatcher::class => [
        'enabled' => env('TELESCOPE_QUERY_WATCHER', true),
        'slow' => 50,
    ],
],
Do not inspect only the single slowest query. Repetition matters too. A 5ms query executed 200 times can hurt more than one 80ms query.
Consider this common example:
$orders = Order::latest()->get();

foreach ($orders as $order) {
    echo $order->customer->name;
}
If the customer relation was not loaded in advance, you will see another query for each order. Telescope makes that pattern easy to spot, leading to eager loading:
$orders = Order::with('customer')->latest()->get();
Run the request again after the change and compare query count and total duration instead of relying on intuition.
Jobs: did the job run or fail?
The Job Watcher shows dispatched jobs, their connection and queue, status, runtime, and attempts. When a job fails, you can inspect the associated exception and stack trace.
Remember that a real queued connection needs a running worker before the job can execute:
php artisan queue:work
A pending job does not always mean its code is broken. The worker may simply be stopped or listening to a different queue.
Exceptions and logs: move from failure to cause
The Exception Watcher stores the exception message, stack trace, and location, then connects the exception to its related request or job. The Log Watcher displays log records written by the application.
Current Telescope versions record logs at error level and above by default. If you need more detail locally, lower the level:
Watchers\LogWatcher::class => [
    'enabled' => env('TELESCOPE_LOG_WATCHER', true),
    'level' => 'debug',
],
Do not leave debug enabled without a reason in a busy environment. It can generate a large amount of data.
Cache, events, and outgoing HTTP requests
The Cache Watcher shows when a key is hit, missed, written, or forgotten. This is useful when you expect cached data but the application keeps returning to the database.
The Event Watcher displays the event, payload, listeners, and broadcast data. The HTTP Client Watcher records outgoing requests made through Laravel's HTTP client, helping you determine whether latency comes from your application or an external API.
Enable only the watchers you need
Each watcher collects a different type of entry. You can control them in config/telescope.php:
'watchers' => [
    Watchers\CacheWatcher::class => env('TELESCOPE_CACHE_WATCHER', true),
    Watchers\EventWatcher::class => env('TELESCOPE_EVENT_WATCHER', true),
    Watchers\JobWatcher::class => env('TELESCOPE_JOB_WATCHER', true),
    Watchers\QueryWatcher::class => [
        'enabled' => env('TELESCOPE_QUERY_WATCHER', true),
        'slow' => 100,
    ],
],
There is little value in collecting everything forever. Disable watchers that do not support your current needs to reduce storage use and overhead. You can also disable Telescope completely:
TELESCOPE_ENABLED=false
Keep sensitive data out of Telescope
Telescope may record headers, request payloads, sessions, and responses. Review hideSensitiveRequestDetails() in TelescopeServiceProvider and add fields used by your application:
protected function hideSensitiveRequestDetails(): void
{
    Telescope::hideRequestParameters([
        '_token',
        'password',
        'password_confirmation',
        'credit_card_number',
    ]);

    Telescope::hideRequestHeaders([
        'authorization',
        'cookie',
        'x-csrf-token',
        'x-xsrf-token',
    ]);
}
The correct field names depend on your application. Review login, payment, webhook, and other endpoints that accept tokens or personal information before using Telescope outside your machine.
Use Telescope safely in production
Starting with local use is usually the safest choice. If you need Telescope in production for a focused investigation, never expose /telescope to everyone.
TelescopeServiceProvider defines a viewTelescope gate. Restrict it to approved users:
use App\Models\User;
use Illuminate\Support\Facades\Gate;

protected function gate(): void
{
    Gate::define('viewTelescope', function (User $user) {
        return in_array($user->email, [
            'admin@example.com',
        ], true);
    });
}
Make sure APP_ENV=production is actually set. An incorrect environment value may cause Laravel to treat the application as local and allow unintended dashboard access.
You should also avoid recording every production operation. The generated provider's default filter records only important entries outside local environments, including reportable exceptions, failed jobs, scheduled tasks, slow queries, and entries with monitored tags:
Telescope::filter(function (IncomingEntry $entry) {
    if ($this->app->environment('local')) {
        return true;
    }

    return $entry->isReportableException()
        || $entry->isFailedJob()
        || $entry->isScheduledTask()
        || $entry->isSlowQuery()
        || $entry->hasMonitoredTag();
});
Adjust the filter to your needs, but do not record every request in a busy application unless you understand the cost and have limited the investigation window.
Prune old Telescope data
Telescope stores entries in the database, and those tables can grow quickly. Schedule the prune command in routes/console.php:
use Illuminate\Support\Facades\Schedule;

Schedule::command('telescope:prune --hours=48')->daily();
Then verify that Laravel's scheduler runs on the server. Writing the schedule in code does nothing if the scheduler itself is not being executed.
The value 48 retains the last 48 hours. Choose a period that matches your application volume and the reason you are using Telescope.
A practical workflow for a slow request
When an endpoint is slow, use this sequence:
- Clear or ignore old entries so your comparison is easy to follow.
- Send one request with the same input that triggers the problem.
- Open it under Requests and note the total duration.
- Inspect Queries for count, time, repetition, and
slowtags. - Inspect HTTP Client entries for slow external services.
- Check Cache entries for expected hits or unexpected misses.
- Review jobs and events dispatched by the request.
- Change one suspected cause, repeat the same request, and compare.
That comparison is more valuable than simply opening Telescope and looking at numbers. The goal is to move from “the API is slow” to a specific, measurable cause.
Conclusion
Laravel Telescope turns hidden application activity into something you can inspect: a complete request, every query and its duration, job status, exceptions, cache operations, events, and outgoing HTTP calls.
Start locally, enable only the watchers you need, hide sensitive values, and compare behavior before and after each change. If you use Telescope in production, restrict access, filter collected entries, and prune data regularly.
For every option and watcher, see the official Laravel Telescope documentation.